Problem Description
Consumers today go through a complex decision making process before subscribing to any one of the numerous Telecom service options ? Voice (Prepaid, Post-Paid), Data (DSL, 3G, 4G), Voice+Data, etc. Since the services provided by the Telecom vendors are not highly differentiated, and number portability is commonplace, customer loyalty becomes an issue. Hence, it is becoming increasingly important for telecommunications companies to pro-actively identify customers that have a tendency to unsubscribe and take preventive measures to retain such customers.
The aim of this blog post is to introduce a predictive model to identify the set of customers who have a high probability of unsubscribing from the service now or in the near future using Personal Details, Demographic information, Pricing and the Plans they have subscribed to. A secondary objective is to identify the features of the Independent Variables (aka ?Predictors?) which cause a great impact on the Dependent Variable (Y) that makes causes a customer to unsubscribe.
Data Description
Input data:
6 months data with 3 million transactions
Predictors / Independent Variables (IV) considered:
? Customer Demographics (Age, Gender, Marital Status, Location, etc.)
? Call Statistics (Length of calls like Local, National & International, etc.)
? Billing Information (what the customer paid for)
? Voice and Data Product (Broadband services, Special Data Tariffs, etc.)
? Complaints and Disputes (customer satisfaction issues and the remedial steps taken)
? Credit History
On the output:
? Target / Response considered for the model:
? The value ?1? indicates UNSUBSCRIBED or CHURN customers
? The value ?0? indicates ACTIVE customers
Note: For the sake of brevity, I am ignoring the steps taken to clean, transform, and impute the data.
Partitioning the Data
In any Predictive Model work, the data set has to be partitioned appropriately so as to avoid overfitting/underfitting issues among other things.
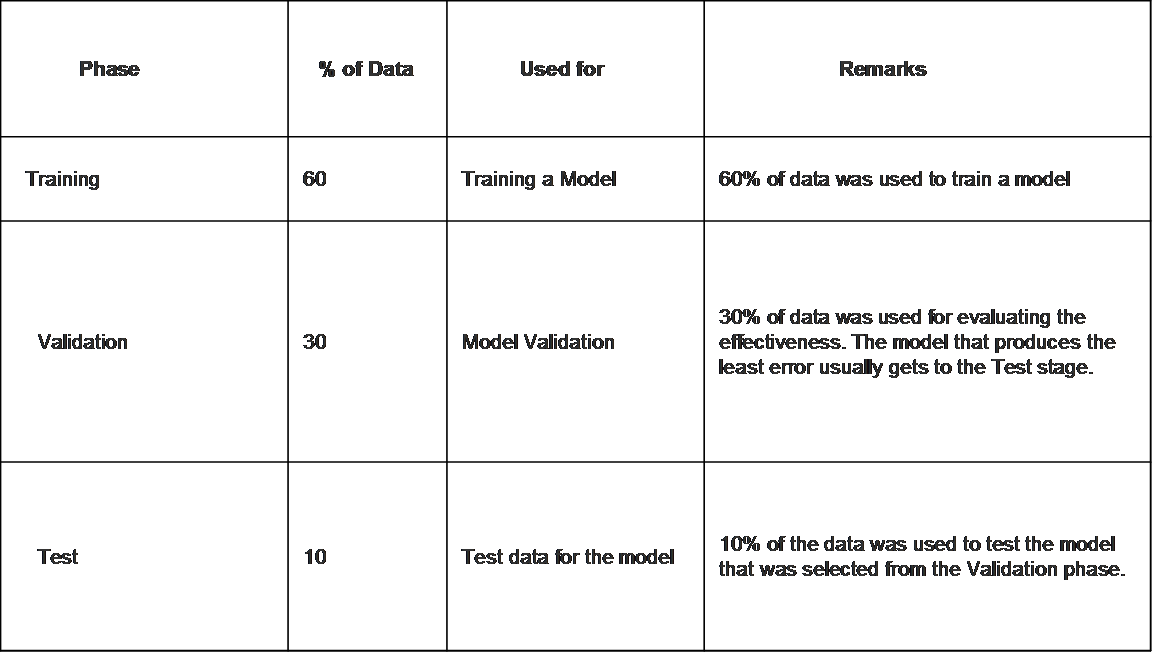
Prediction Accuracy & Model Selection
Models built on TRAINING DATA set is validated using the VALIDATION DATA set. It is common to build multiple models including ensembles and compare their performance. The model that eventually gets deployed is the one that benefits the business the most, while keeping the error rate within acceptable limits.
Here are the 2 common error types in Churn Prediction:
Type I Error ? False Negative ? Failing to identify a customer who has a high propensity to unsubscribe.
From a business perspective, this is the least desirable error as the customer is very likely to quit/cancel/abandon the business, thus adversely affecting its revenue.
Type II Error ? False Positive ? Classifying a good, satisfied customer as one likely to Churn.
From a business perspective, this is acceptable as it does not impact revenue.
Any Predictive Algorithm that goes into Production, will have to be the one that has the least Type I error.
In our case, we used multiple algorithms on a Test data set of 300k transactions to predict Churn. Shown below are the results from the top 2 performing algorithms:
Algorithm 1: Decision Tree
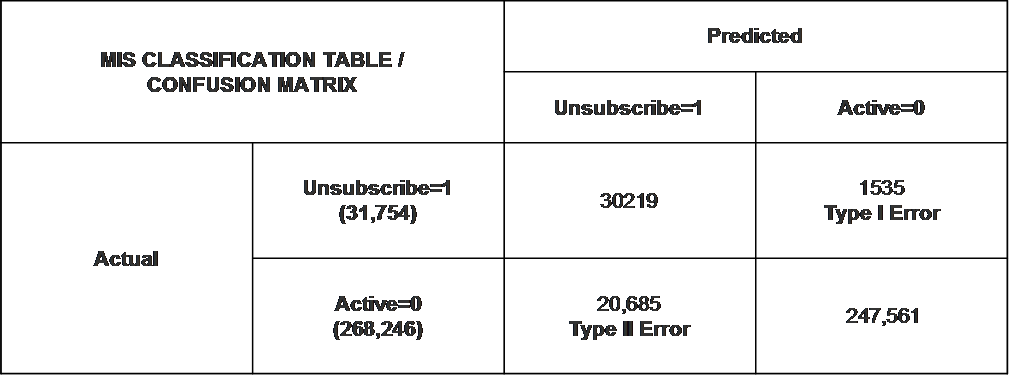

Algorithm 2: Neural Networks
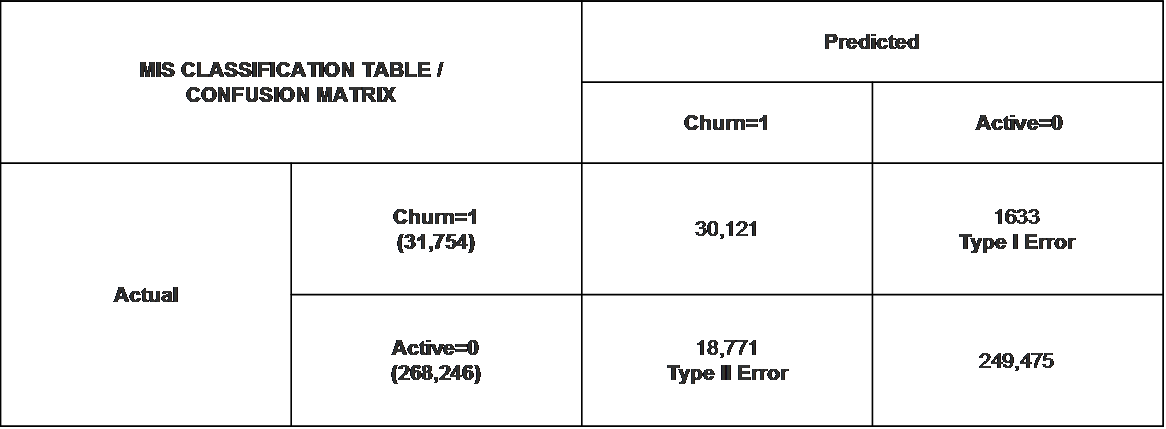

Though the overall Error Rate of Neural Network was less than the Decision Tree algorithm, the Decision Tree model was chosen for deployment because of the higher Type I error rate for Neural Network.
Model was chosen not only based on Prediction Accuracy, but also based on the impact of Type I Error.
Technology
R was used to build, validate, and test the models with the 3 million transaction data set.
It was re-implemented in Spark/MLLib/Scikit-Learn/HDFS to deal with larger data sets.
Results
? Model predicts the likelihood of Customer Churn high accuracy.
? Key variables that were impacting Customer Churn or causing significant impact on the ?Y? were:
? Age (age groups 21-40)
? Salary (lower salaries)
? Data Usage (those who used more data services)

Comments